How to use AgMet graphics for Crop Condition analysis?
Contents
How to use AgMet graphics for Crop Condition analysis?#
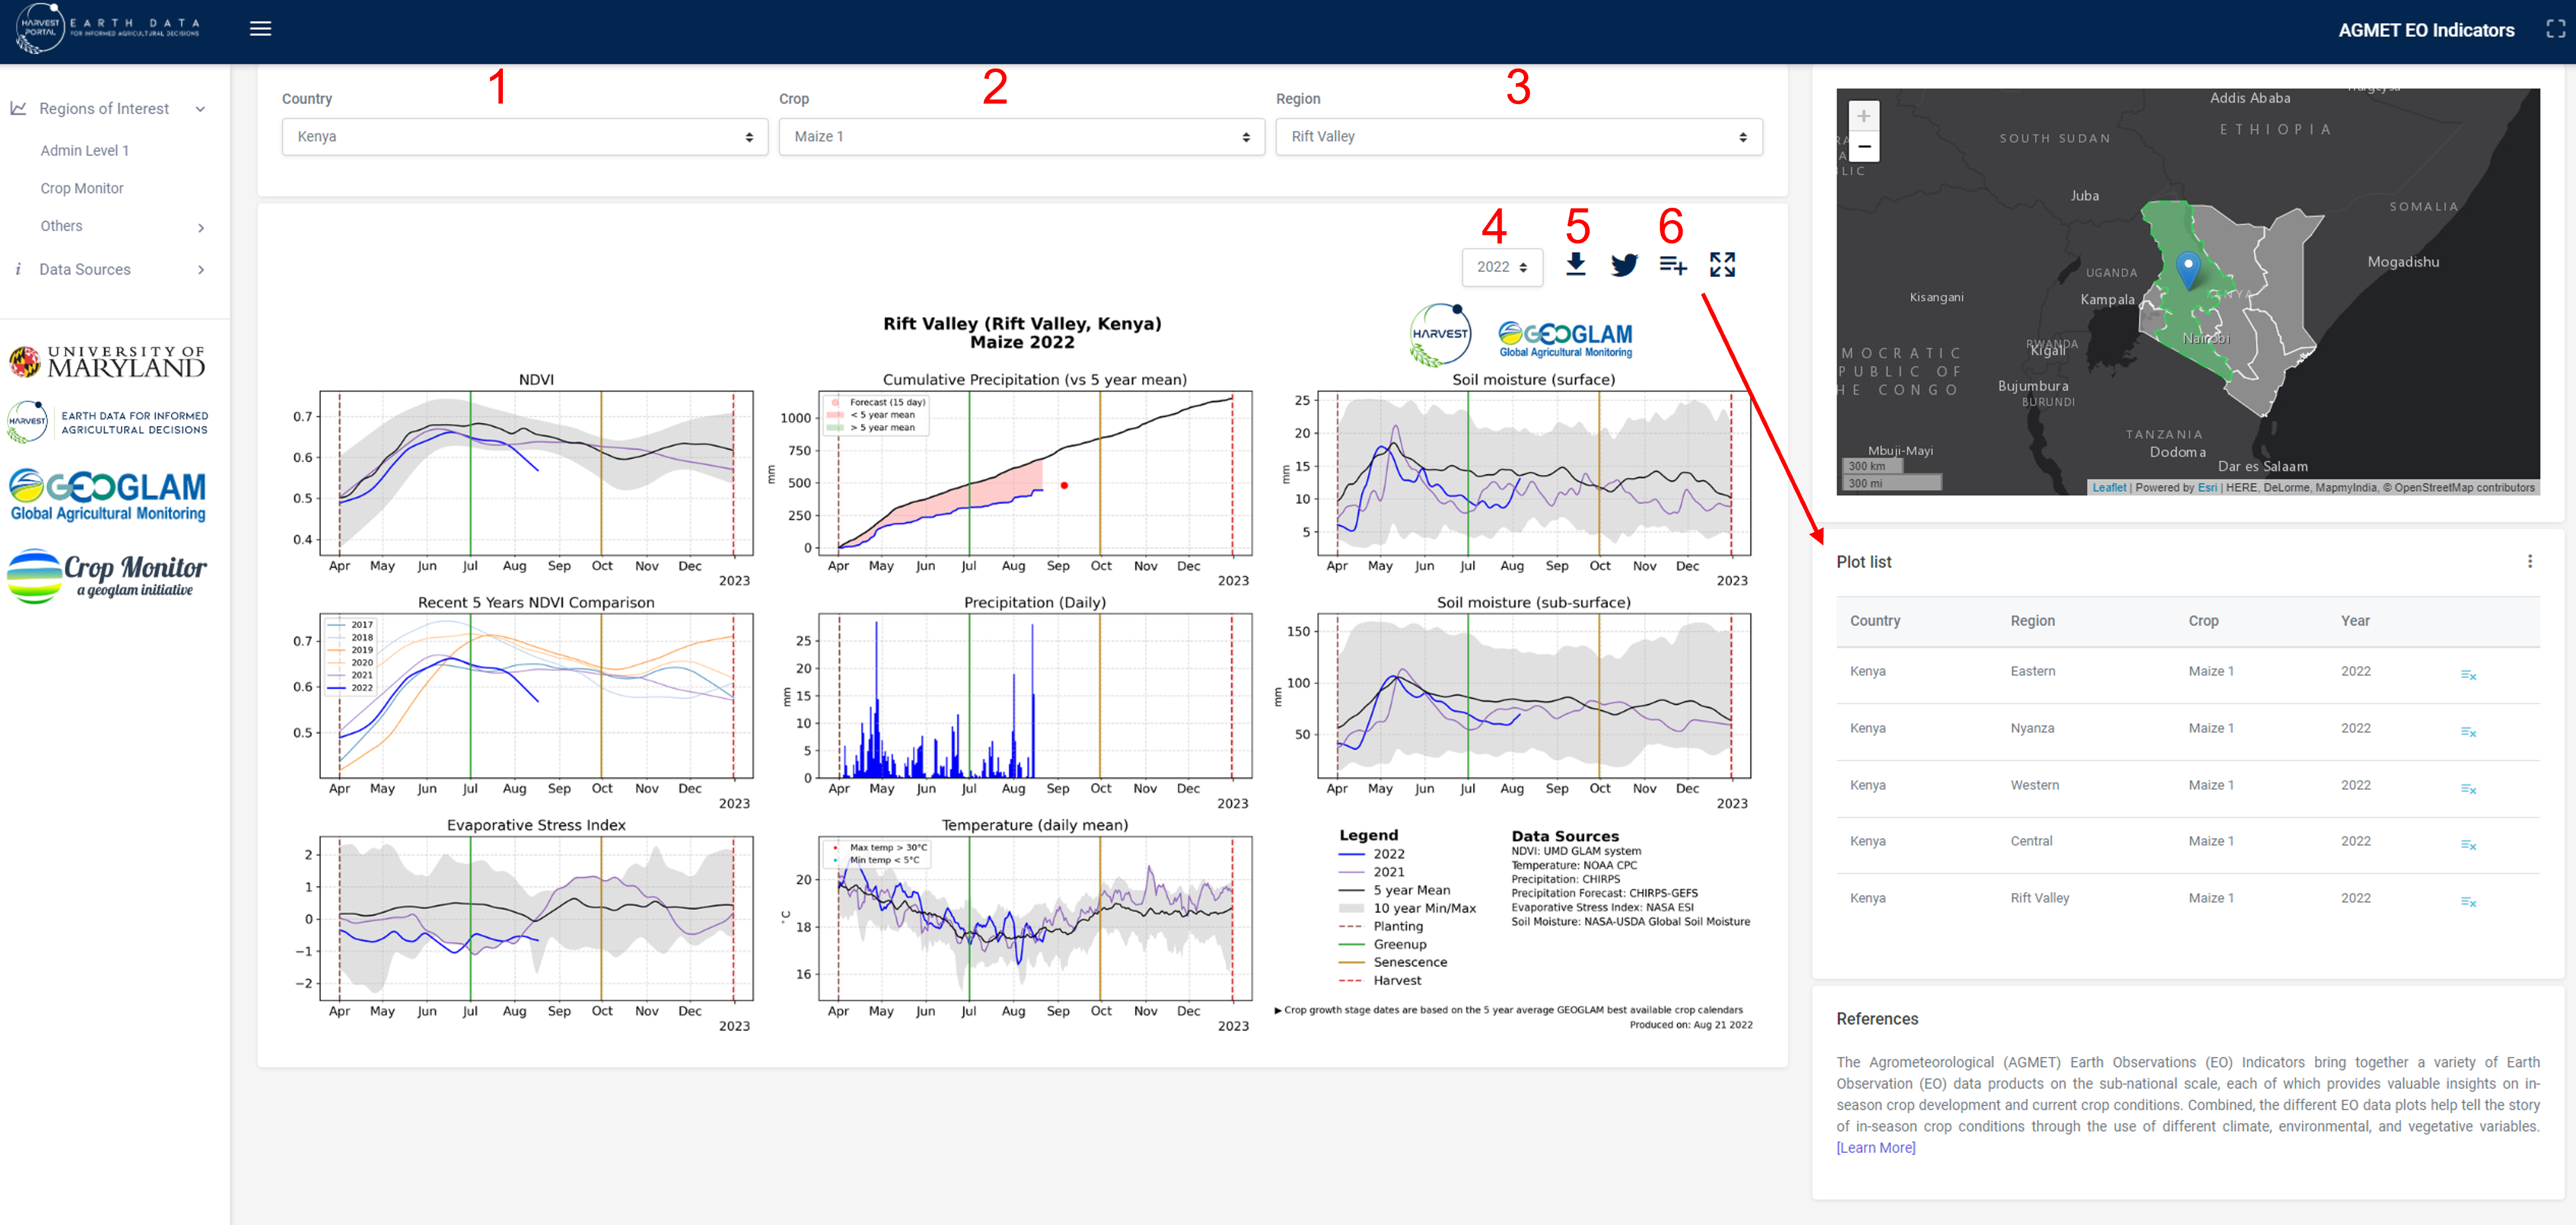
The AgMet indicators are available here. These indicators include analysis ready suite of crop condition indicators: NDVI, Precipitation, Temperature, Evaporative Stress Index, Soil Moisture. They are processed over the cropping calendar and crop mask for the specific ROI and provide subnational browsable data (menu & map). The tool offers 5 years of data ready to be visited. (2016 – 2021) and is updated biweekly. Here is a quick walkthrough of the tool:
Select your Country of interest
Select your Crop of interest
Select Admin 1 of interest
Select Cropping Year (2016 - 2022)
Download Plots
Save plots into your ‘Plot List’ feature for easy viewing
Examples of Crop Condition Analysis using AgMet Indicators#
1. Mashonaland East, Zimbabwe 2020 vs 2021 season comparison#
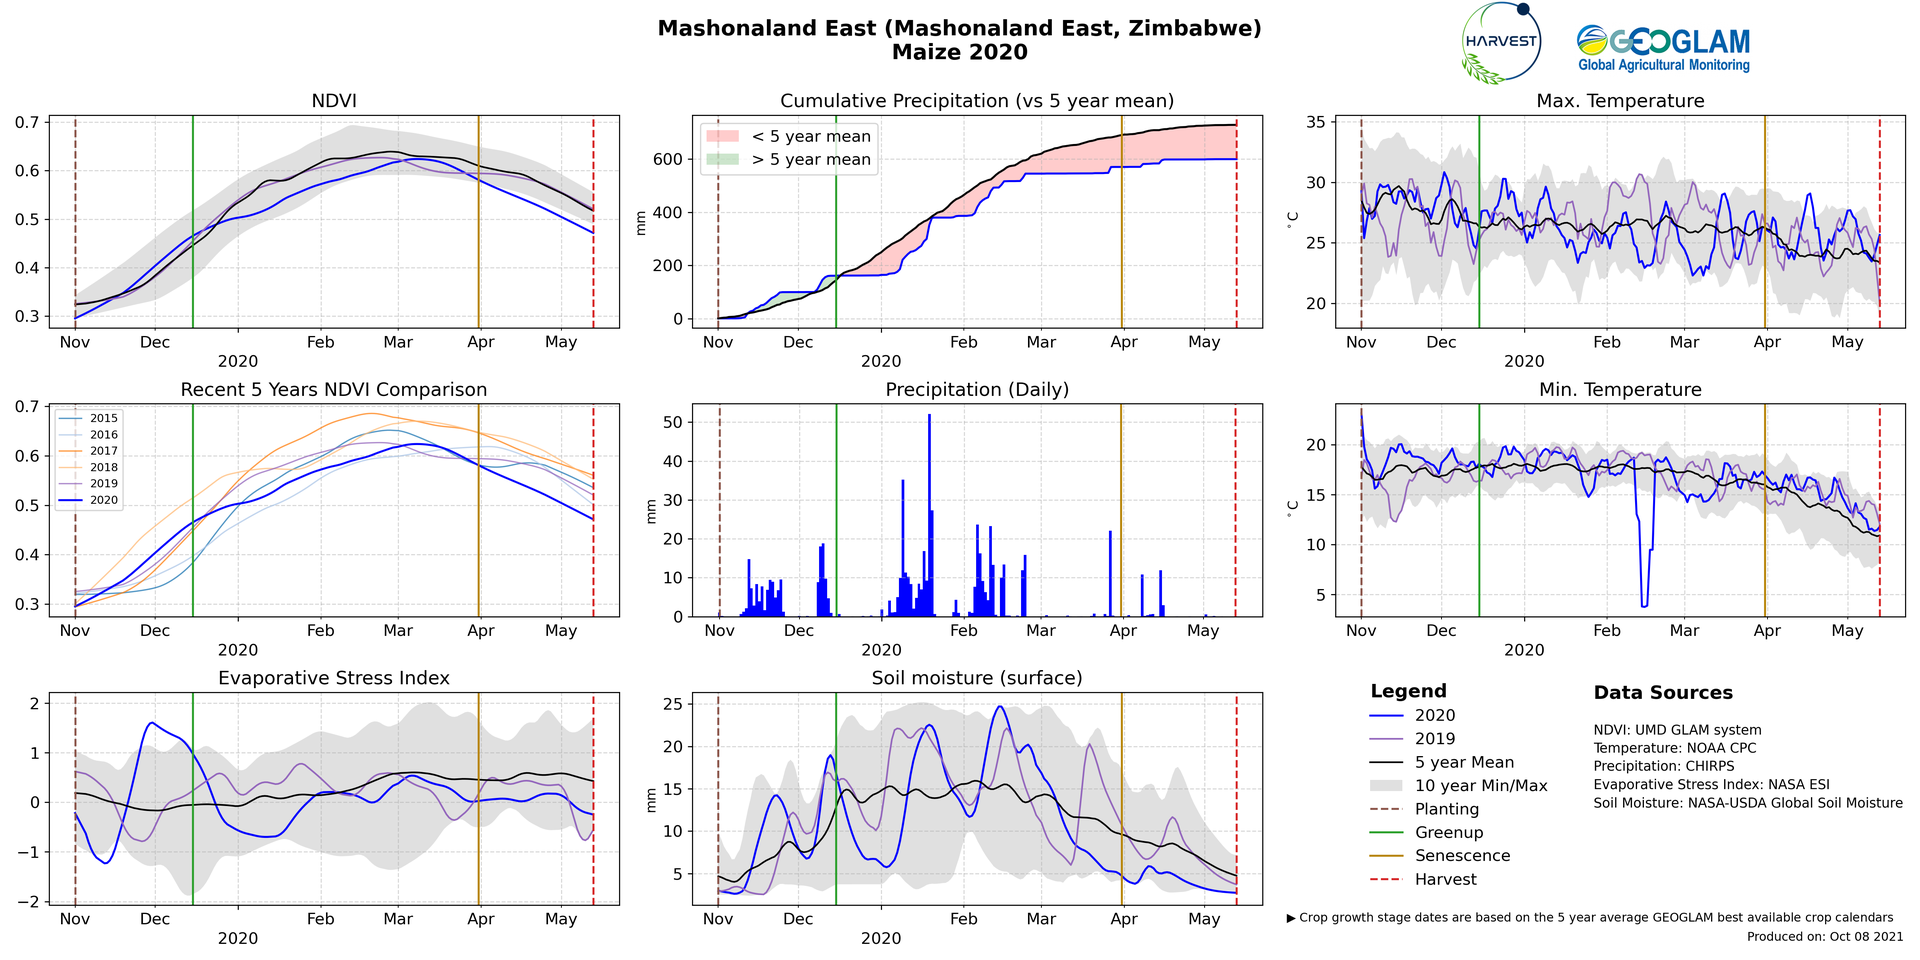 Maize 2020 season had a poor start to the rains and below average rainfall throughout which resulted in 2020 maize harvest of 908,000 tonnes - about half its annual requirements.
Cumulative Rainfall below the 5 year average from mid-December
NDVI tracking below the 5 year average from January
Improvement from heavy rainfall event in late January
From April NDVI tracking at the lowest in the last 5 years
Final Outcome: Poor
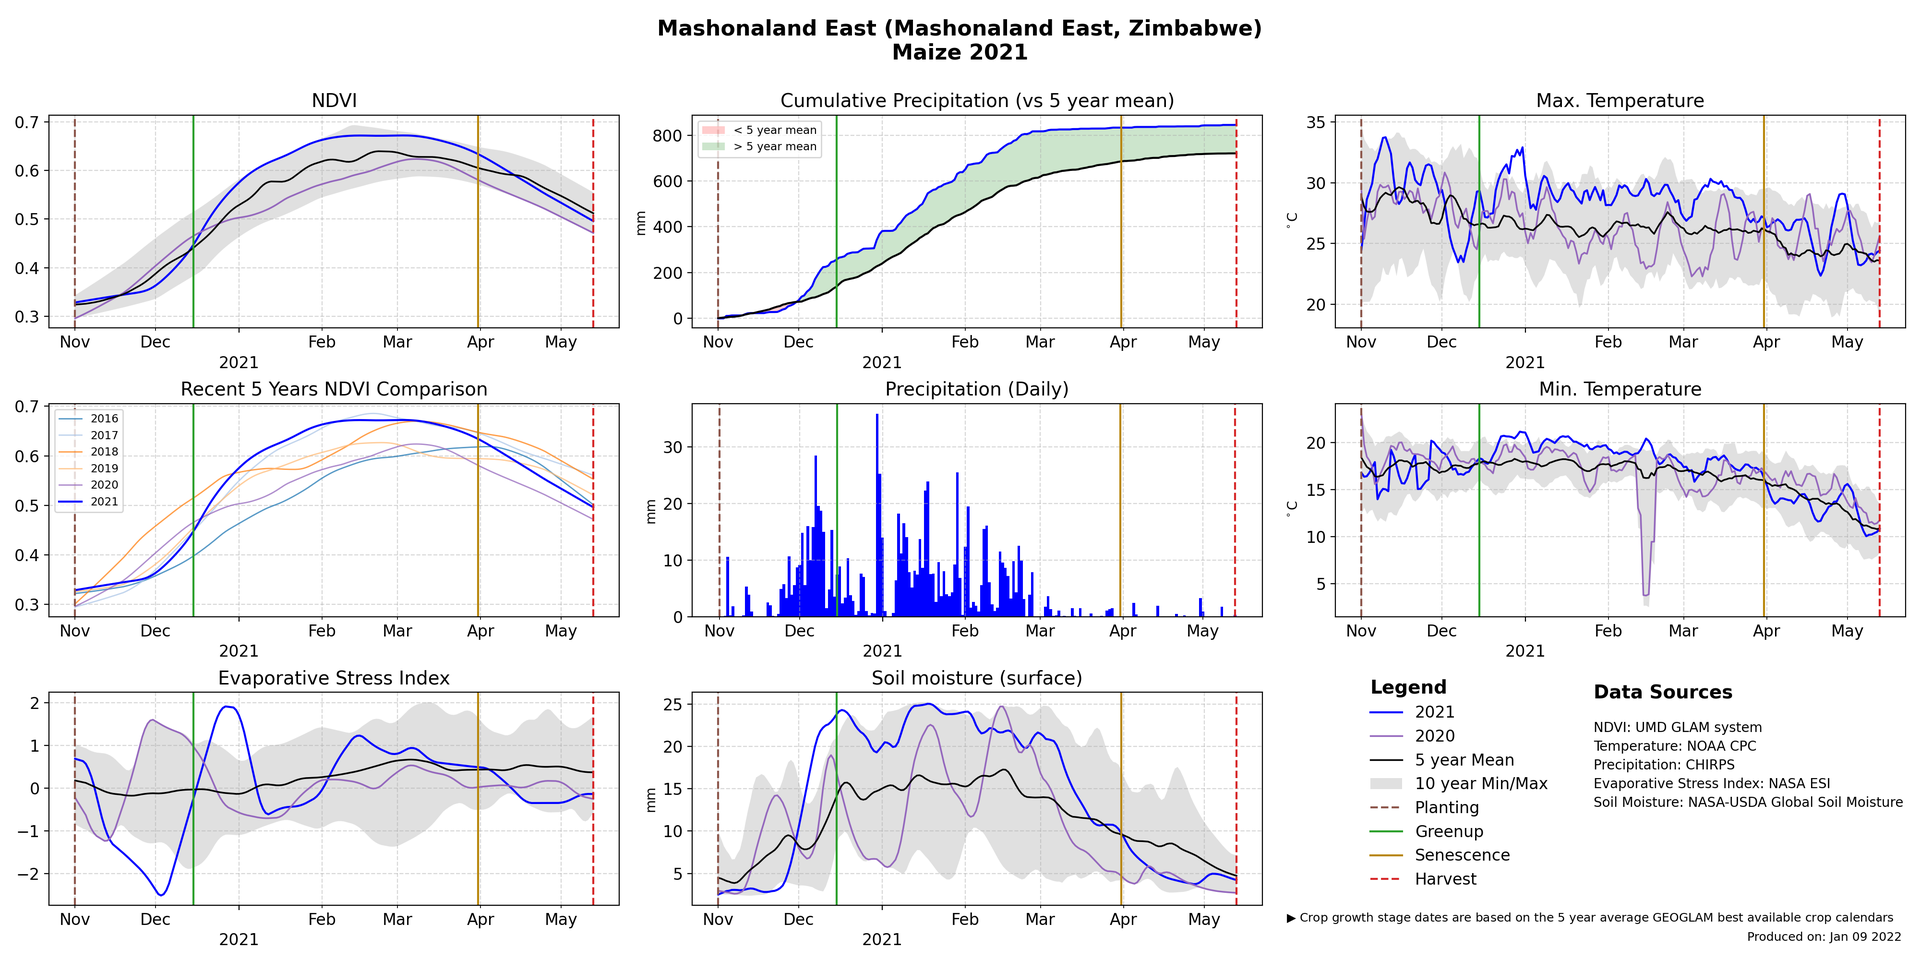 Maize 2021 season had a timely start to the rains and consistent rainfall throughout resulting in a bumper harvest of over 2.7 million tonnes, 3x larger than 2020 output
NDVI tracking above the 5 year average from mid-December and at the 10 year max
Cumulative Rainfall above the 5 year average from mid December
Recent five year comparison shows NDVI 2021 near 2016 level
Well distributed precipitation throughout the season
Final Outcome: Exceptional, bumper harvest
2. Central Zambia, 2020 vs 2021 season comparison#
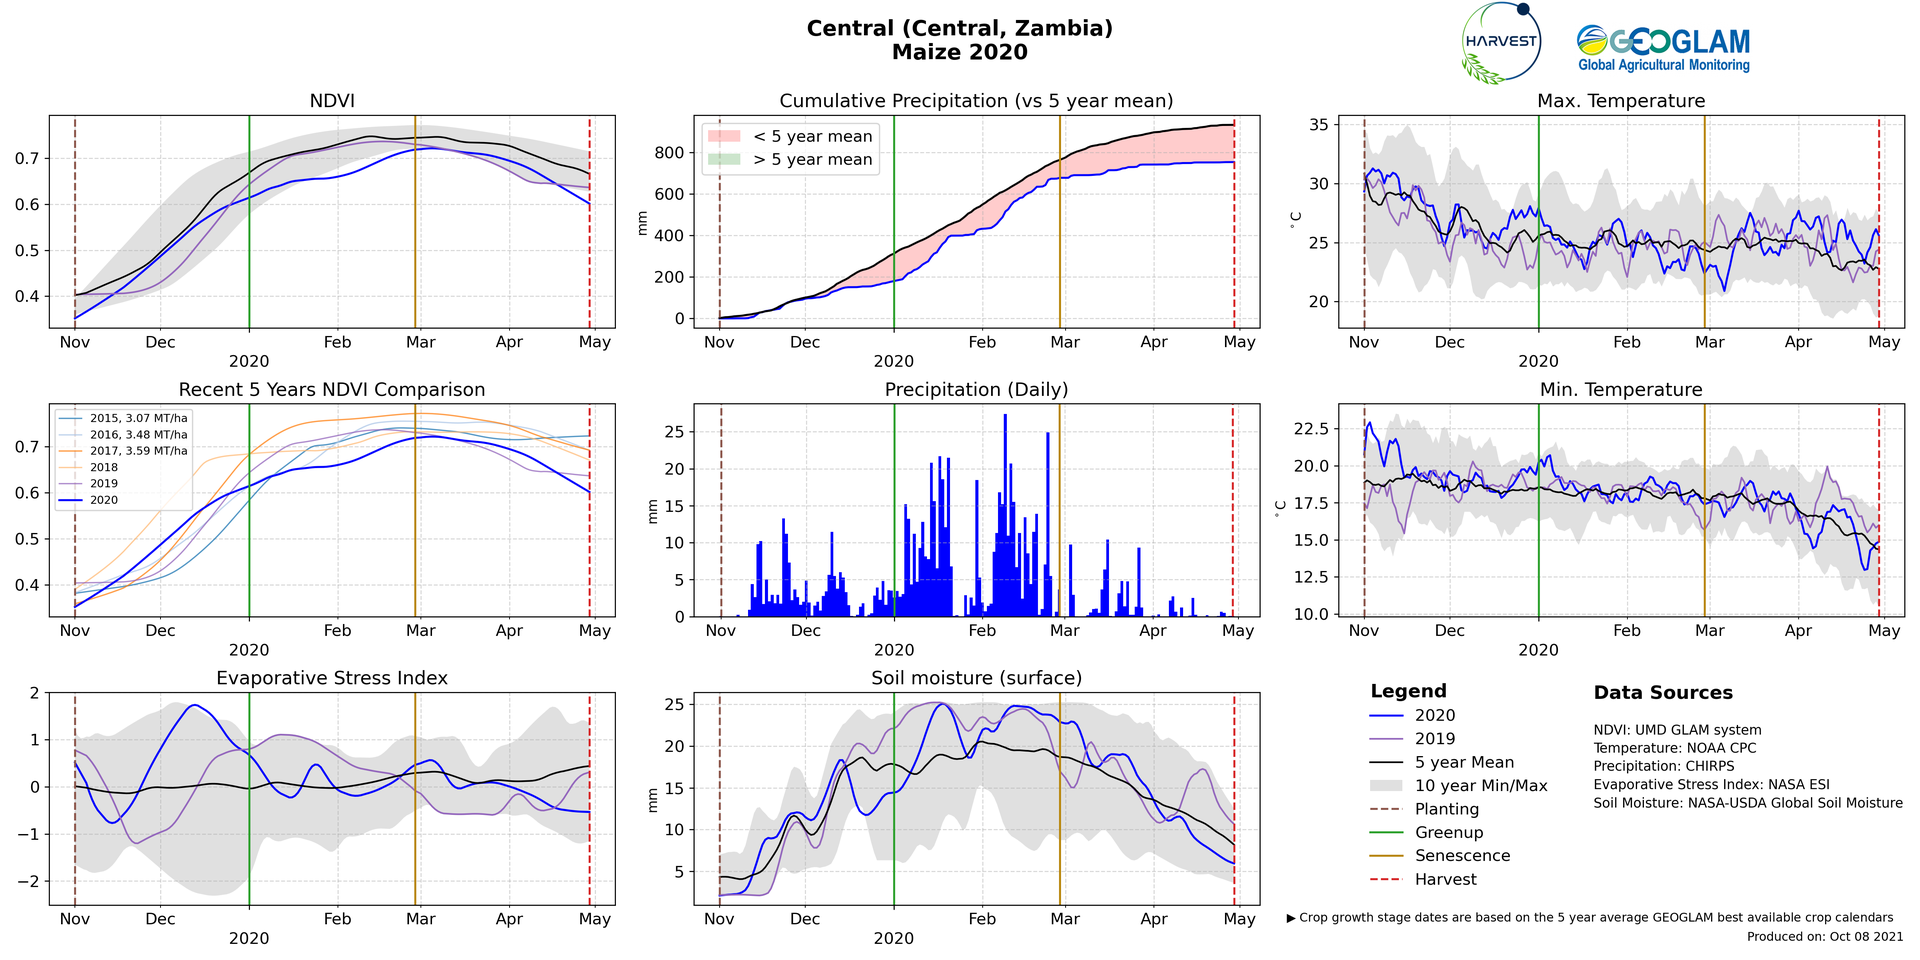 Maize 2020 season started with normal rainfall onset in November and slightly below average cumulative precipitation while NDVI and cumulative rains were slightly below average. However, above average harvest resulted 3.4 mt maize at national level
NDVI tracking below the 5 year average
Cumulative Rainfall below the 5 year average from mid-December and remains below average throughout
ESI and soil moisture showing normal to above average conditions throughout much of the season and soil moisture above average
Final Outcome: Favourable
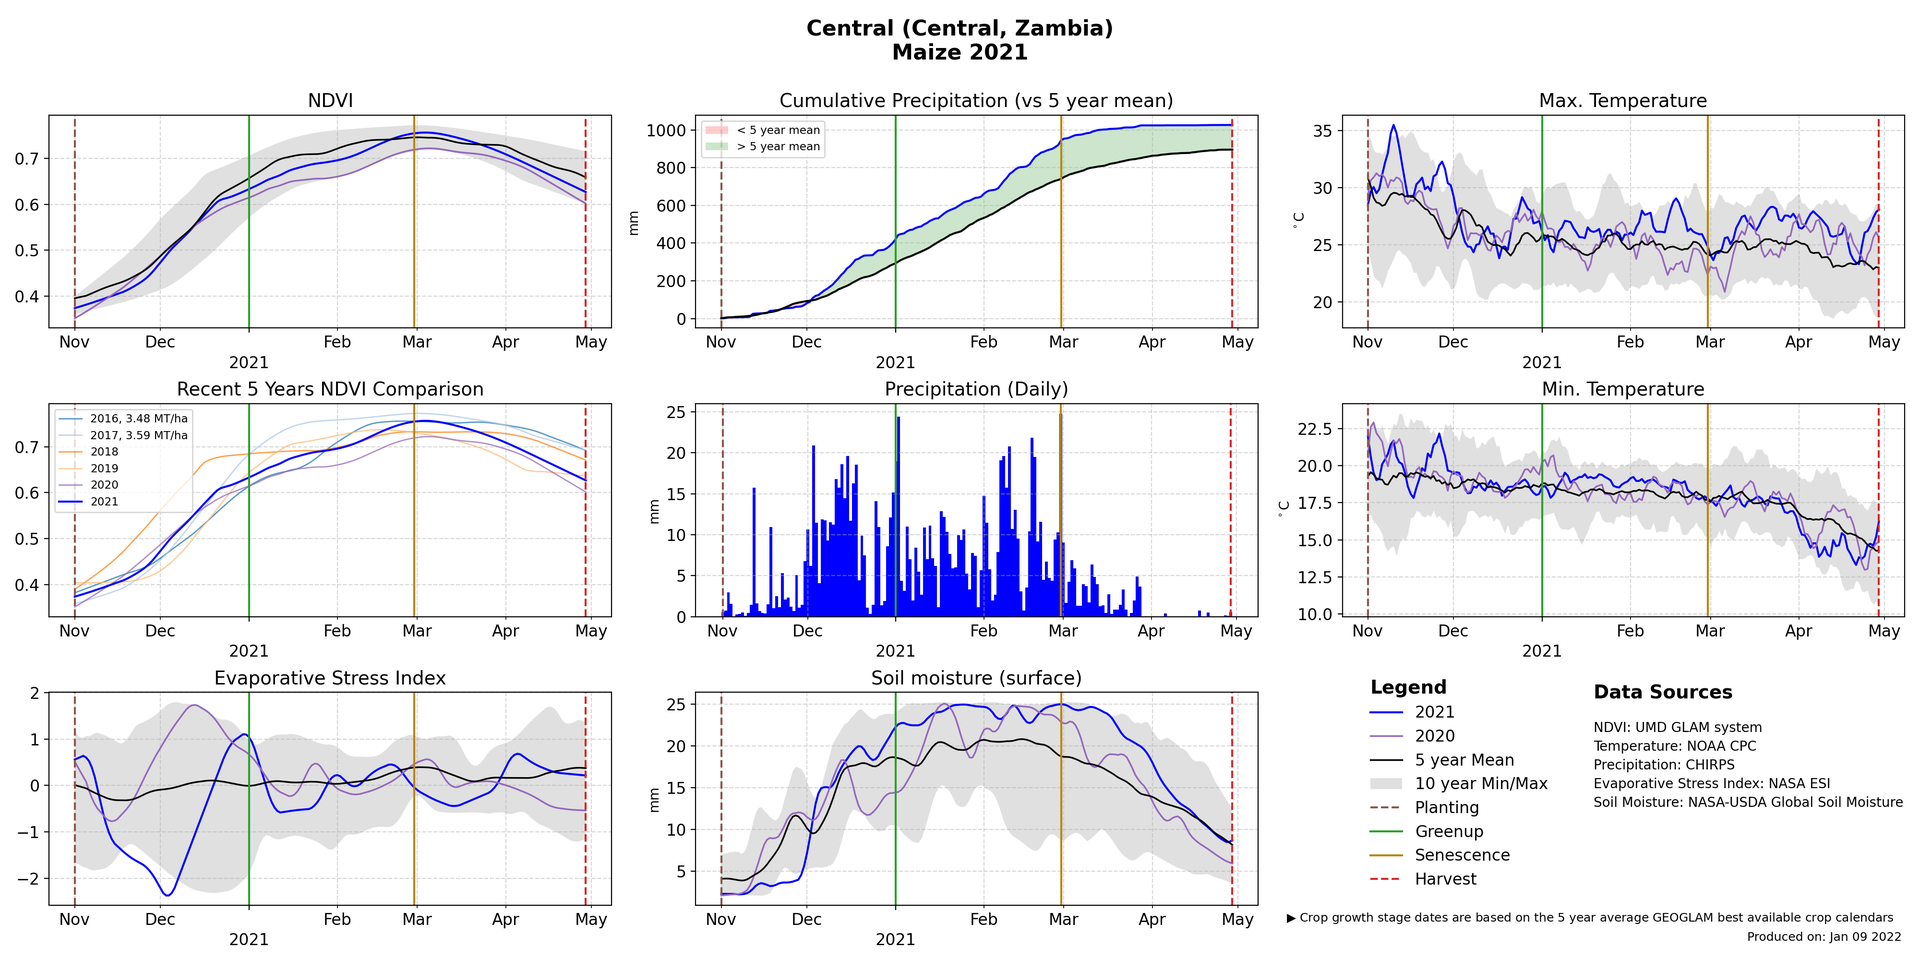 Maize 2021 season started with a normal onset in November and above average rains continued through much of the season average to above average national production resulted 3.6 mt maize at national level
2021 production slightly higher YoY
NDVI above 2020 level and close to the 5 year average
Cumulative precipitation above average throughout the season
Soil Moisture above the 5 year average and near the 10 year max
Daily Precipitation shows precipitation well distributed throughout key points in the season
Final Outcome: Favourable
3. Huila, Angola 2020 vs 2021 season comparison#
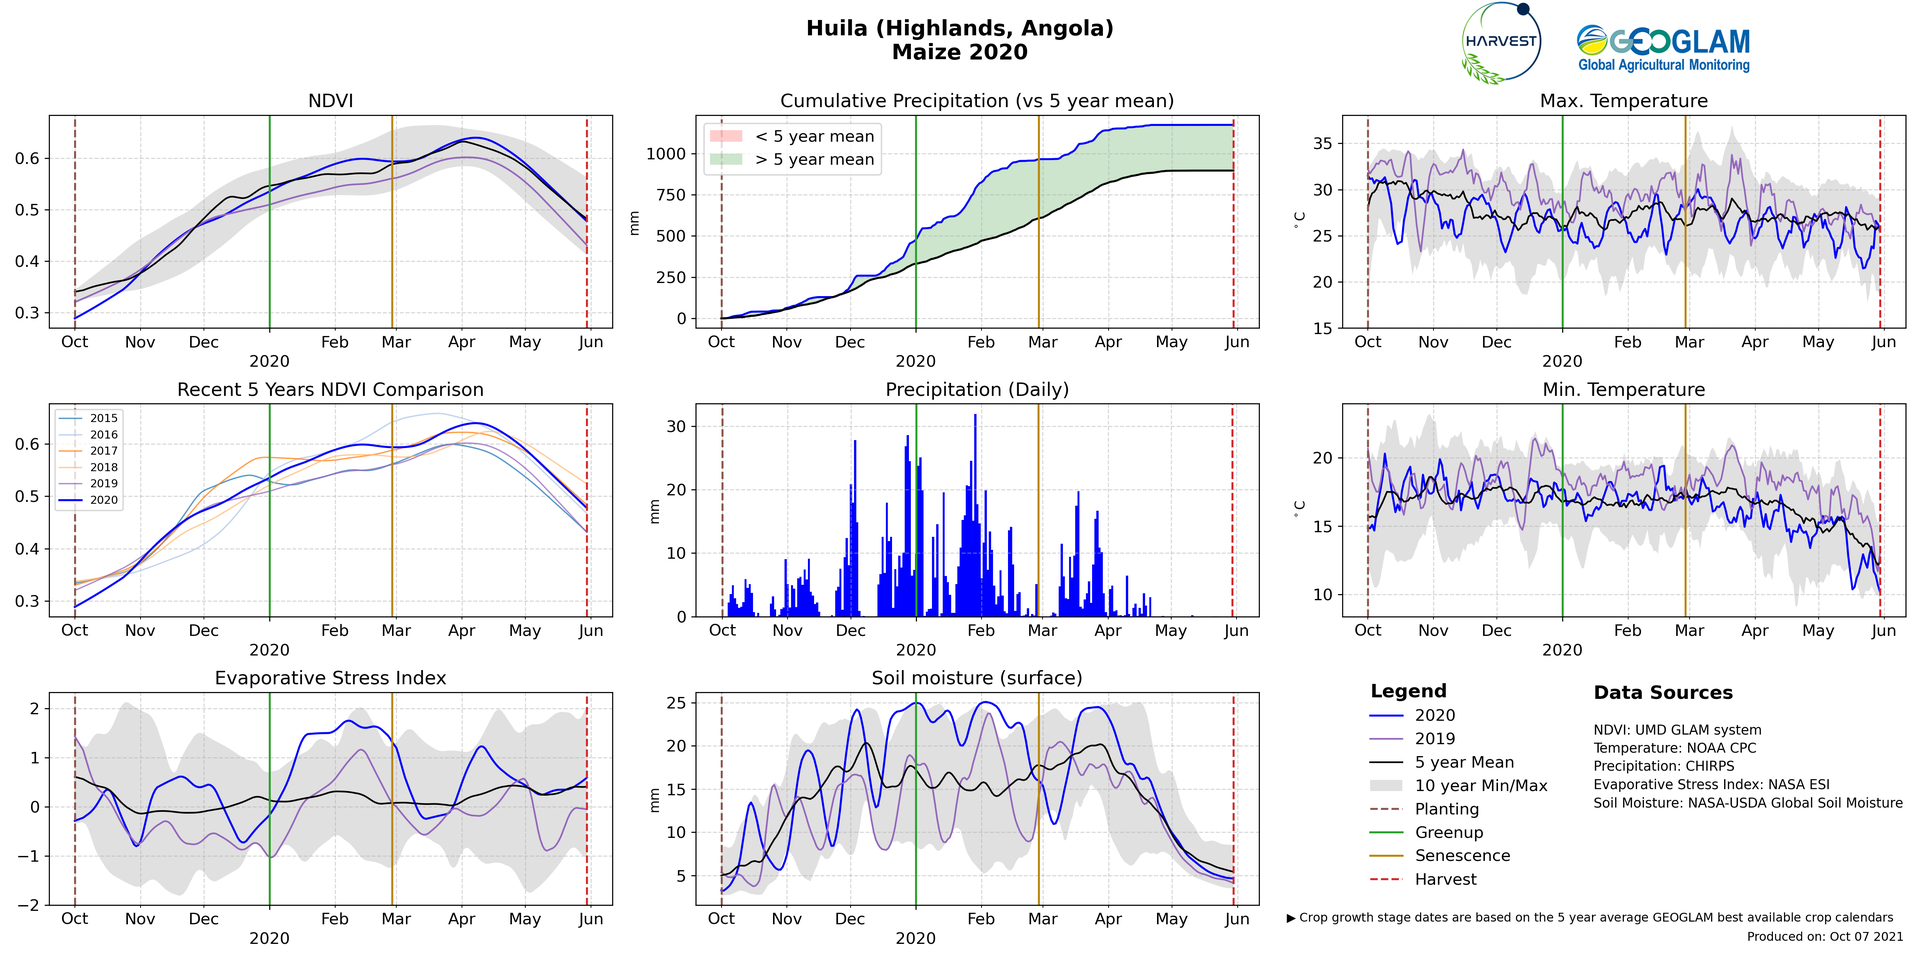 Maize 2020 season started with onset rains in October and above average rains from December, all indicators showing above average conditions
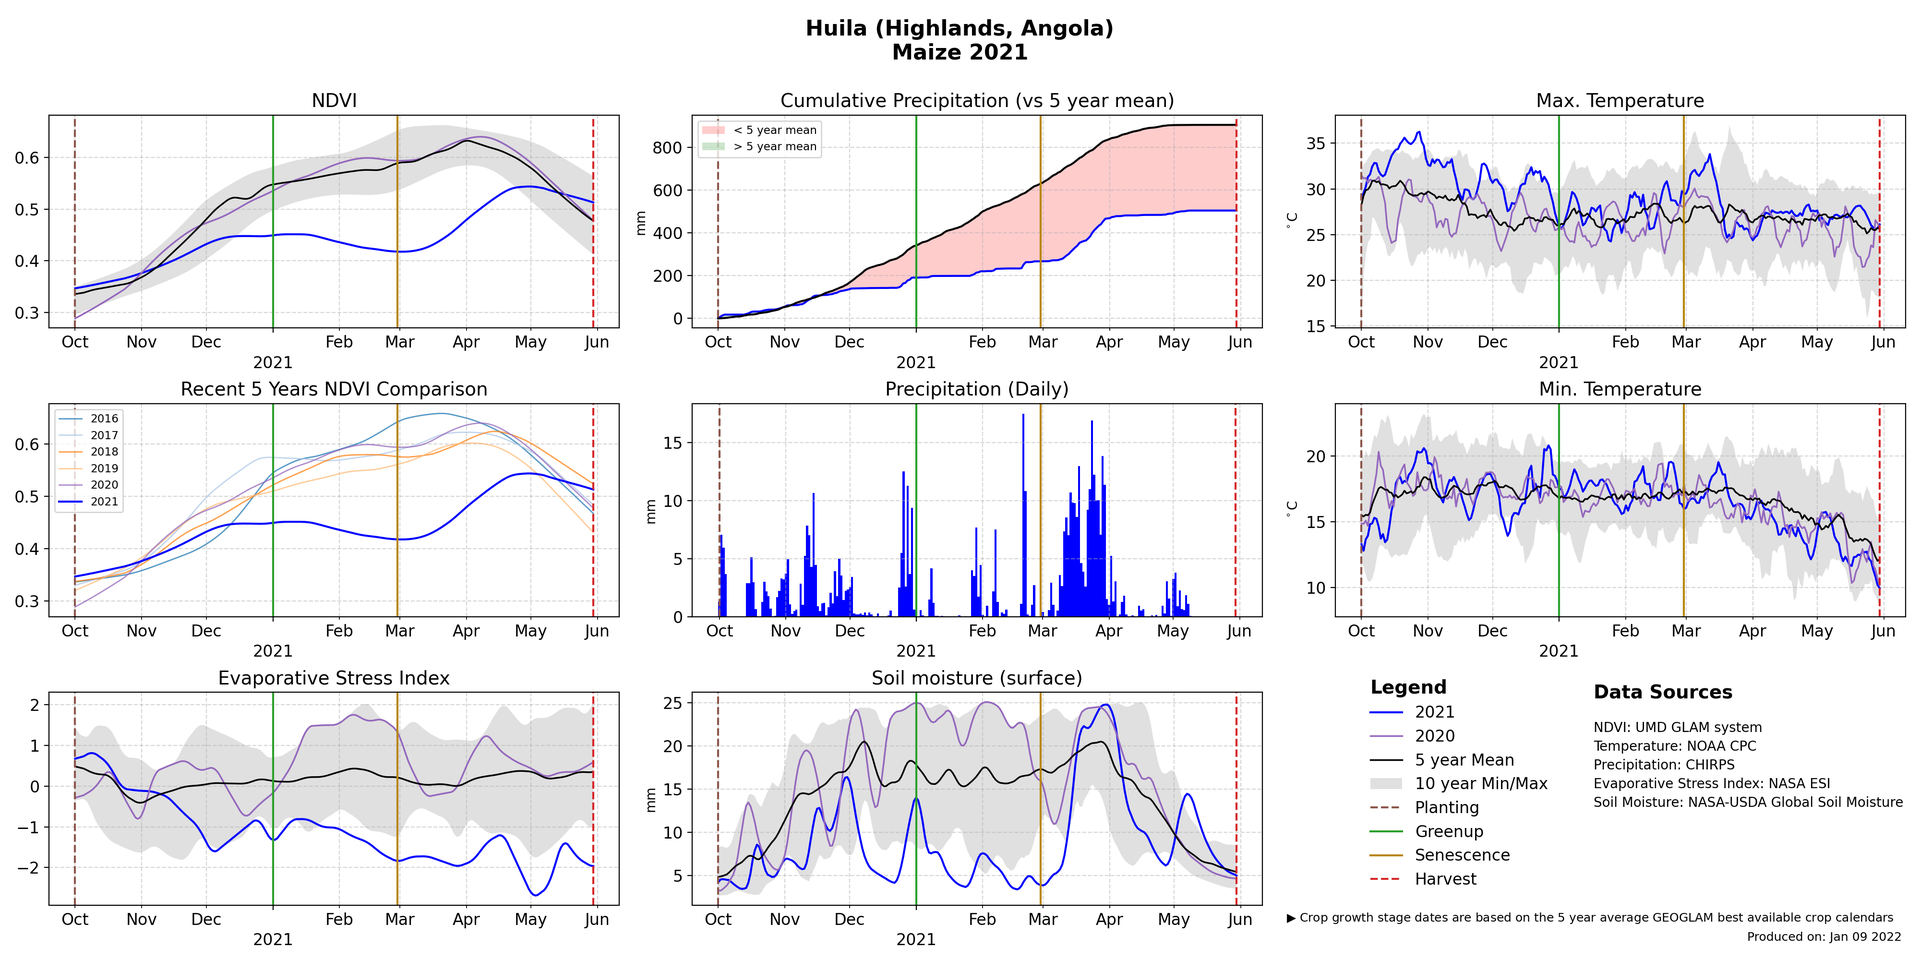 Maize 2021 started with normal onset rains in October with near-average rainfall amounts through November, precipitation levels dropped significantly below average until the end of February 2021 and erratic and below average rainfall combined with high temperatures resulted in below average conditions
4. What might have caused the dip in ESI values in January in Mashonaland West?#
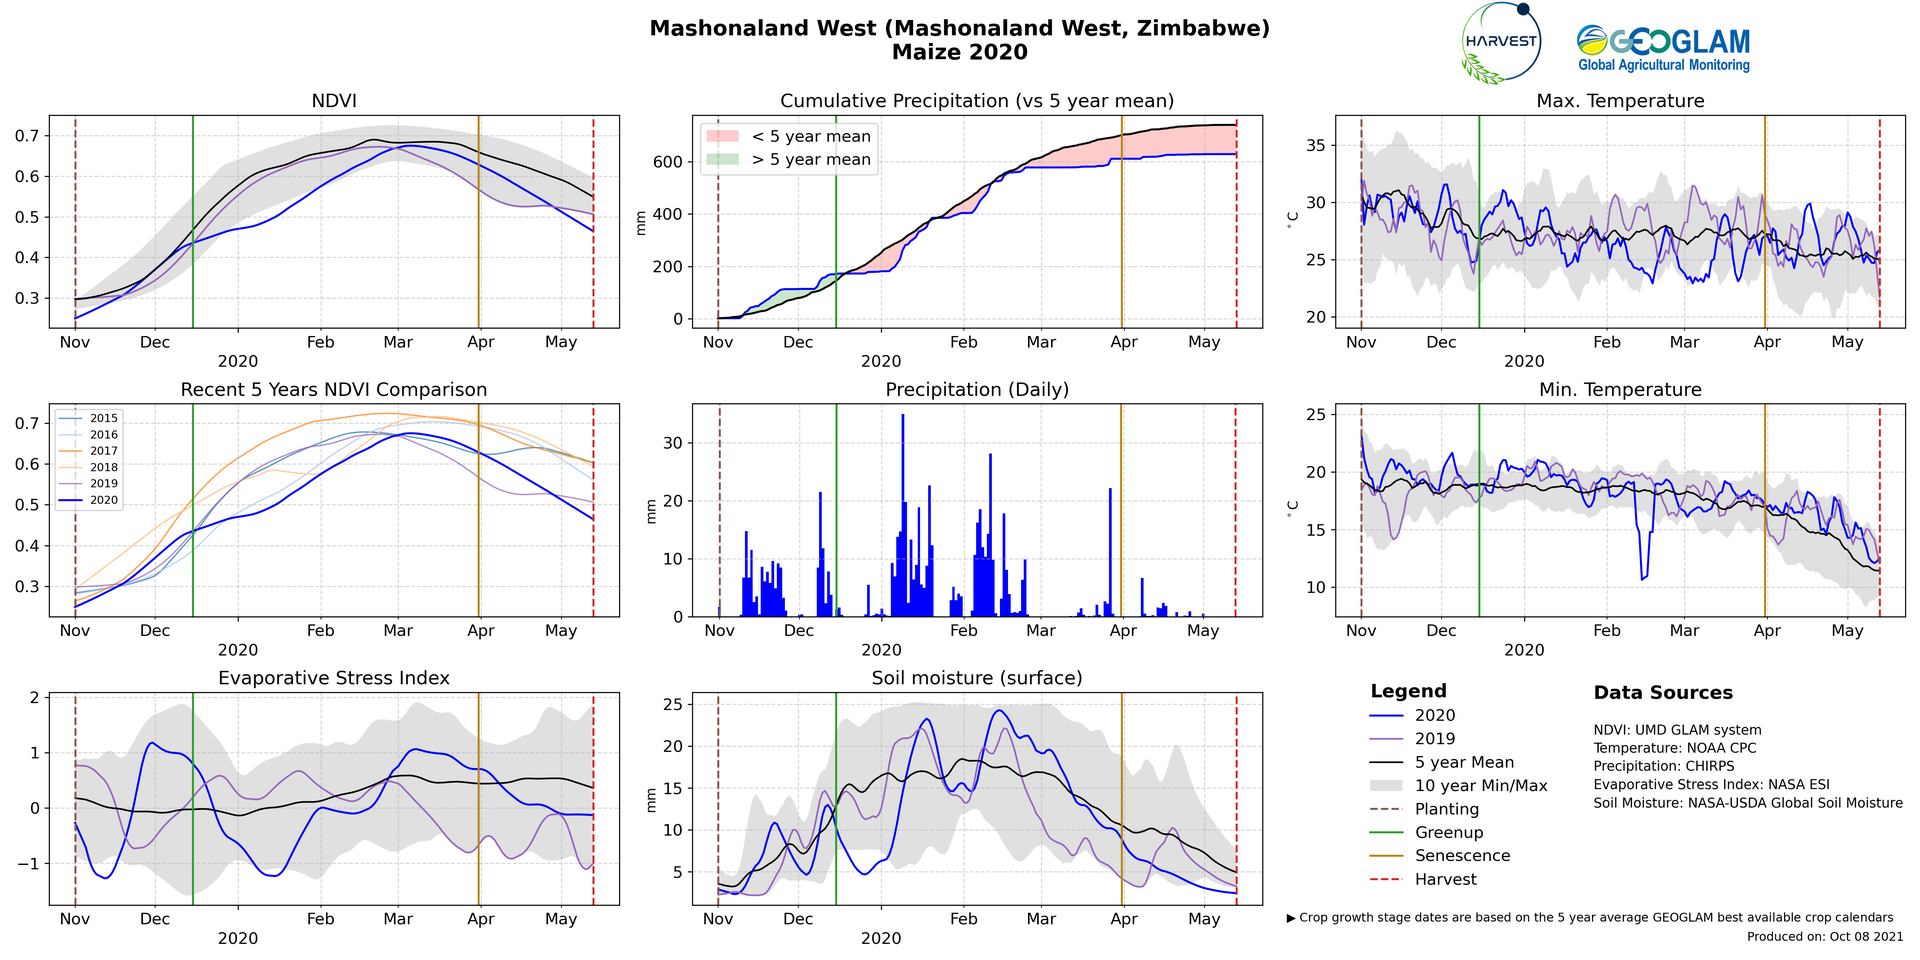
While the season started with normal onset and above average rains, a dry spell in December to January caused significant stress on crops followed by erratic rains through the season. Below average yields resulted for the 2020 cropping season in Mashonaland West
5. How will you interpret the crop conditions in Free State, South Africa in the following AgMet plot?#
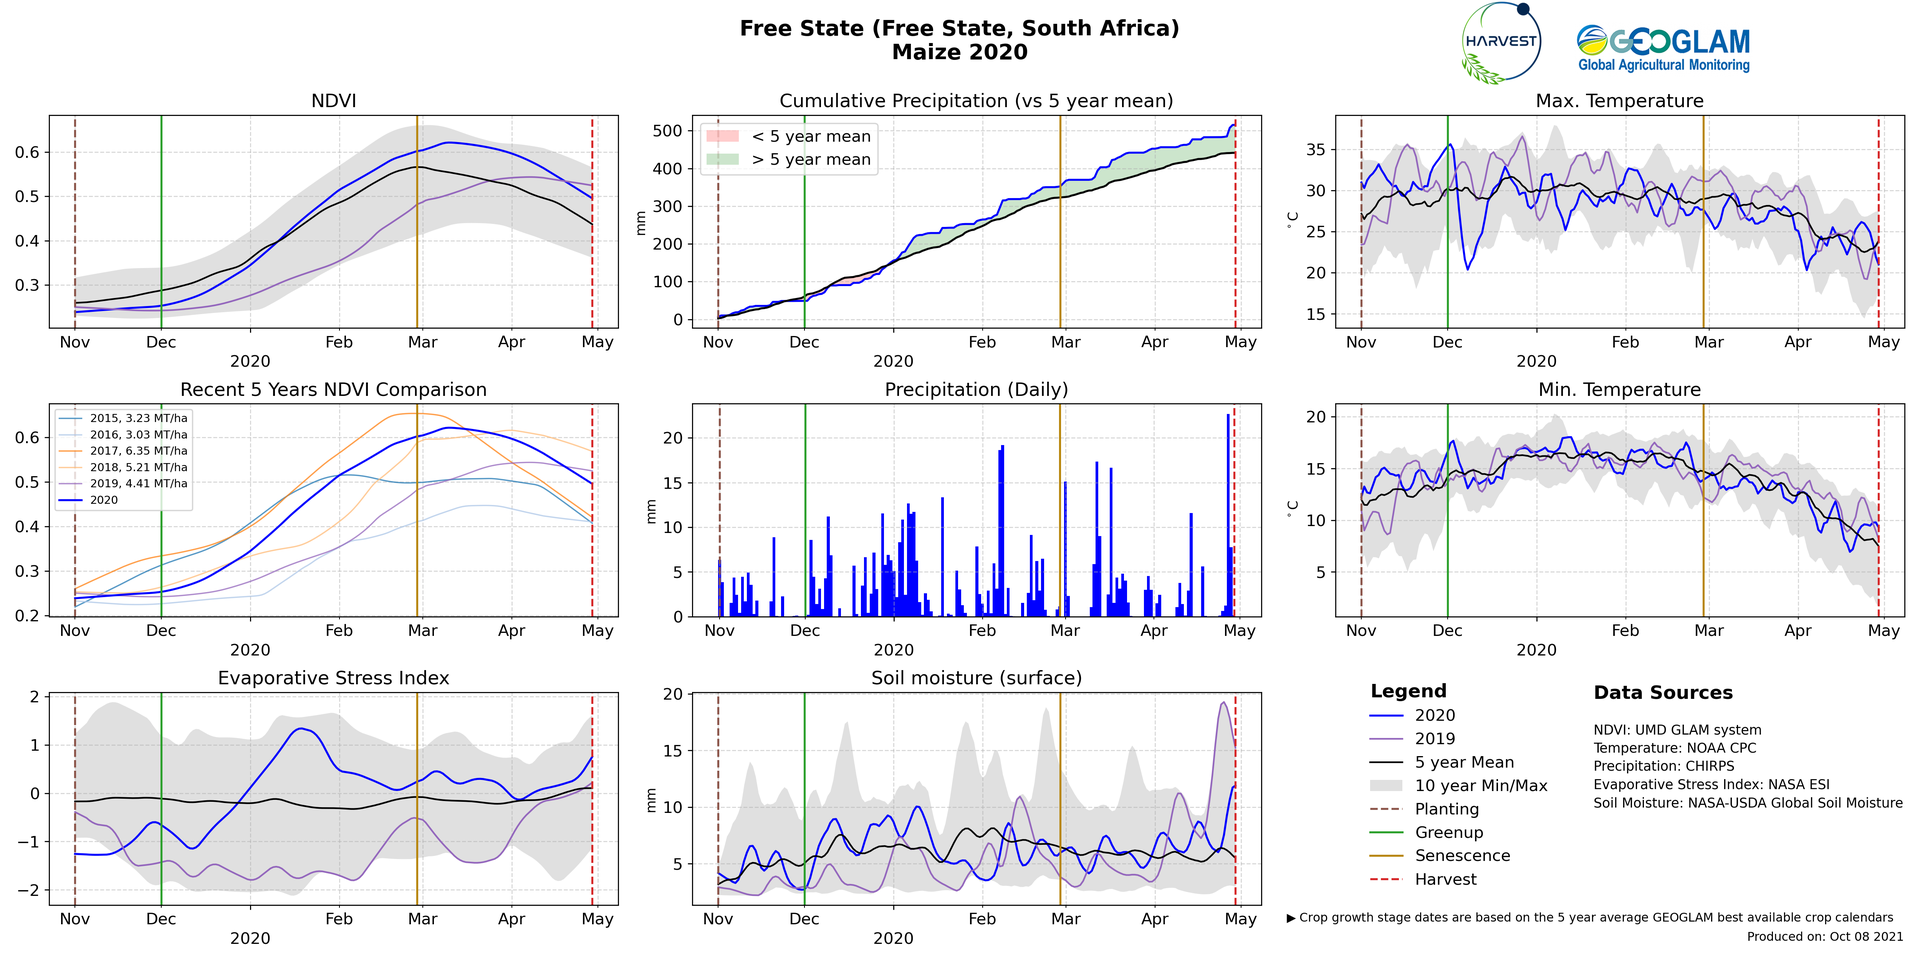 Average start to the season with onset rains in November. ESI showing no stress on crops and above average conditions. From December consistent rains throughout the season tracking at above average levels and NDVI above average from February. Above average yields resulted for the 2020 cropping season in Free State
