Agrometeorological Earth Observation Indicators
Contents
Agrometeorological Earth Observation Indicators#
The Agrometeorological (AgMet) Earth Observations (EO) Indicators bring together a variety of Earth Observation (EO) data products on the sub-national scale, each of which provides valuable insights on in-season crop development and current crop conditions. Combined, the different EO data plots help tell the story of in-season crop conditions thought the use of different climate, environmental, and vegetative variables
AgMet EO Indicators Explained#
The GEOGLAM-NASA Harvest Agrometeorological (AGMET) Earth Observation (EO) Indicators bring together a variety of Earth Observation (EO) data products on the sub-national scale, each of which provides valuable insights on in-season crop development and current crop conditions. Combined, each EO data plot helps tell the story of in-season crop conditions through the use of different climate, environmental, and vegetative variables. Detailed descriptions of the different components within the crop condition plots can be found below and in the corresponding NASA Harvest article.
Further in-depth discussion on different EO data products for crop monitoring see EO Data.
EO data plot components#
Basic components:#
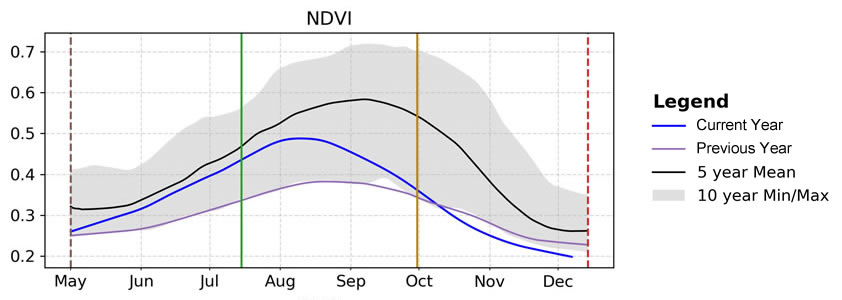
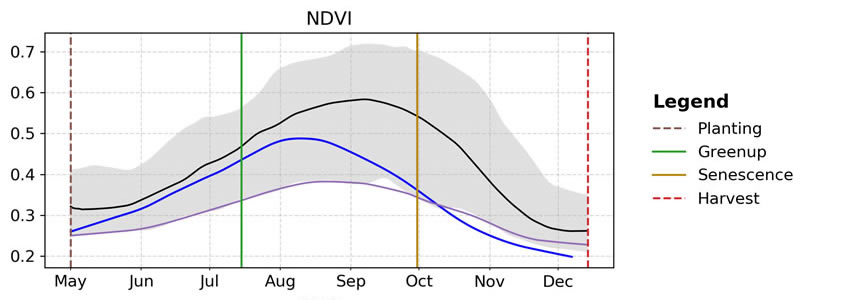
Within each plot, there are several main components. The light gray area shows the span of most recent 10-year minimum and maximum values across the season in order to provide a better understanding of the particular EO data product’s variability over time. The black lines show the most recent 5-year mean values across the season in order to demonstrate what average conditions usually represent. The purple lines show what the values were across the previous season. The blue lines show what the values are for the current season in near real-time as the season progresses.

Crop Calendars:#
Each plot consists of four vertical lines to provide a reference for where crops are in the development stage, based on the GEOGLAM Crop Monitor crop calendars. The brown dotted line represents the planting stage, the green solid line represents greenup (the beginning of plant growth), the brown solid line represents senescence (late development stage), and the red dotted line represents the end of harvest. By examining the main components of each plot within the context of where crops are in their development cycle, analysts can better interpret how current conditions may impact the remainder of the season and final crop outcomes.
For more information, please see crop calendars.

